Scilab is free and open-source software for numerical computation providing a powerful computing environment for engineering and scientific applications. Scilab is released as open-source under the GPL License and is available for download free of charge. Scilab is available under GNU/Linux, Mac OS X and Windows XP/Vista/7/8/10.
Scilab includes hundreds of mathematical functions. It has a high-level programming language allowing access to advanced data structures, 2-D and 3-D graphical functions.
A large number of functionalities is included in Scilab:
- Maths & Simulation
For usual engineering and science applications including mathematical operations and data analysis. - 2-D & 3-D Visualization
Graphics functions to visualize, annotate and export data and many ways to create and customize various types of plots and charts. - Optimization
Algorithms to solve constrained and unconstrained continuous and discrete optimization problems. - Statistics
Tools to perform data analysis and modeling - Control Systems
Standard algorithms and tools for control system study - Signal Processing
Visualize, analyze and filter signals in time and frequency domains. - Application Development
Increase Scilab native functionalities and manage data exchanges with external tools. - Xcos - Dynamic systems modeling
Modeling mechanical systems, hydraulic circuits, control systems...
The ability to interconnect with third-party technologies and applications, Scilab can also act as a unique platform to bring together codes written in different programming languages in a single, unified language, thus facilitating their distribution, their back-up, and use.
SOFTWARE
Numerical Analysis
Data Visualization
App Development
Numerical Analysis
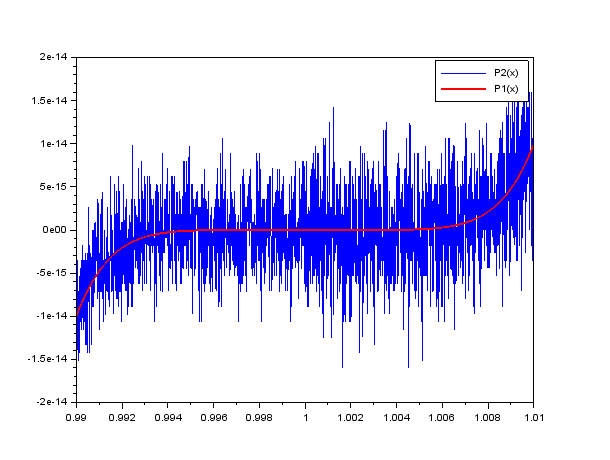
Numerical analysis or Scientific computing is the study of approximation techniques for numerically solving mathematical problems.
Scilab is based on methods of numerical computation:
- Data analysis
- Algorithm development
- Model
Available methods include:
- Interpolation and regression
- Differentiation and integration
- Linear systems of equations
- Fourier analysis
- Ordinary differential equations (ODEs)
- Matrix computation (determination of eigenvalues and singular values)
Data visualization
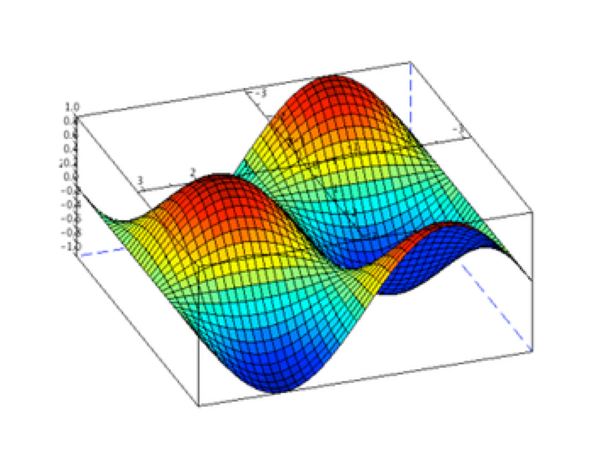
Scilab provides graphics functions to visualize, annotate and export data and offers many ways to create and customize various types of plots and charts:
- Lines
- Pie charts
- Histograms
- Surfaces
- LaTeX / MathML annotations
- Online Help chapter
- Graphics export in many formats: PNG, PPM, EMF, EPS, FIG, PDF, SVG.
- Online Help chapter
App development
Data management
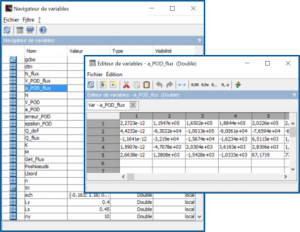
Scilab provides facilities to manage data exchanges with external tools:
- Advanced data structures and user-defined data types
- Matlab binary files reading and writing
Online Help chapter - Excel links
Online Help chapter
Algorithms development
- With more than 2000 mathematical functions
- With integrated help, also available online
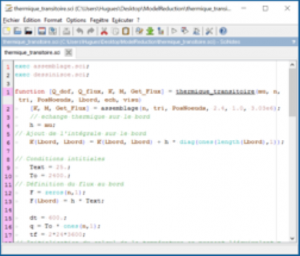
- With an integrated editor Scinotes
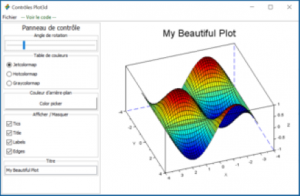
Graphical User Interface
For Desktop application
Your final users won’t need to master the development environment of Scilab, they will access your application directly through a dedicated graphical user interface (GUI)
- Consult the tutorial of Opening
- Consult the wiki and the online help
***More information: https://www.scilab.org/
